Project 1: American FactFinder
Objective:
For this assignment, you will be analyzing information from the US Census Bureau's American Factfinder service. This tool consolidates information from the deccennial census and the more detailed American Community Survey samples. Your final product should create a chloropleth map to test a geographic stereotype.
For this assignment, you will be analyzing information from the US Census Bureau's American Factfinder service. This tool consolidates information from the deccennial census and the more detailed American Community Survey samples. Your final product should create a chloropleth map to test a geographic stereotype.
Task:
Step 1: Testing Your Hypothesis
- To begin, write down three geographic stereotypes you believe you could test.
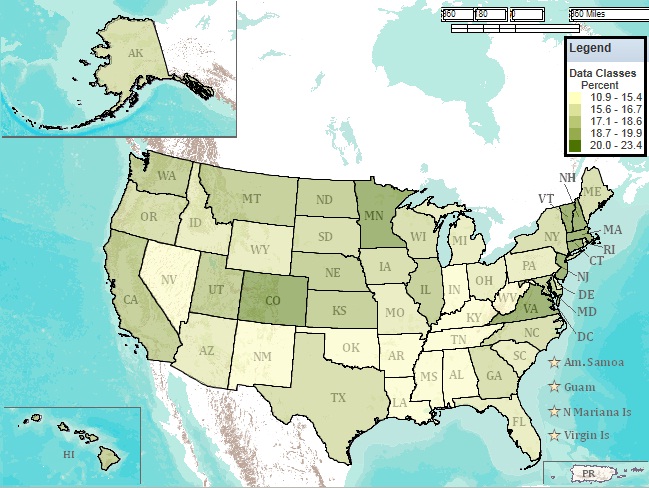
For this example, I'm testing the stereotype that more Americans hold bachelors degrees in the northern states than southern states.
- Visit the US Census Bureau's American FactFinder
- Select the topic which would best fit your first hypothesis
For my example, I selected Education, then Education Attainment
- Next, select the geographic scale that best fits your hypothesis (State, County, Census Tract, etc.)
I selected States, then All US States
- Then, select the study which best fits your hypothesis
I selected Selected Social Characteristics of the United States
- When the table appears, select "Create a Map," and then click on one cell that you would like to see comparisons of on a map.
I selected a cell with the percentage of citizens with a bachelor's degree in Alabama
- If all went well, you should get a map to display the appropriate information. You can then adjust the colors, data classes, and map scales to fit your needs.
I changed the data classes from natural breaks to quantile.
- Finally, use screen capture or the snipping tool to save the image of the map, map scale, and legend.
I copied the image of the map into paint, then copied the legend so I could lay it over the map.
Step 1: Testing Your Hypothesis
- To begin, write down three geographic stereotypes you believe you could test.
For this example, I'm testing the stereotype that more Americans hold bachelors degrees in the northern states than southern states.
- Visit the US Census Bureau's American FactFinder
- Select the topic which would best fit your first hypothesis
For my example, I selected Education, then Education Attainment
- Next, select the geographic scale that best fits your hypothesis (State, County, Census Tract, etc.)
I selected States, then All US States
- Then, select the study which best fits your hypothesis
I selected Selected Social Characteristics of the United States
- When the table appears, select "Create a Map," and then click on one cell that you would like to see comparisons of on a map.
I selected a cell with the percentage of citizens with a bachelor's degree in Alabama
- If all went well, you should get a map to display the appropriate information. You can then adjust the colors, data classes, and map scales to fit your needs.
I changed the data classes from natural breaks to quantile.
- Finally, use screen capture or the snipping tool to save the image of the map, map scale, and legend.
I copied the image of the map into paint, then copied the legend so I could lay it over the map.
Percentage of Citizens Holding a Bachelor Degree (Age 25 and older)
Step 2: Analysis
Respond to the following prompts in a Word Document so you can add them to your website at the end.
1. Briefly explain your hypothesis and the process of creating your map.
2. Did the data support your geographic stereotype? Why or why not?
3. Review Mark Mormonier's Lying With Maps, which we read at the begining of the course. What were some of his criticisms of chloropleth maps. Can you see these concerns on your map?
4. How does map scale influence viewer's perceptions of your map? Would zooming in or out change the results?
5. How could the American FactFinder be used by public agencies and private corporations?
Step 3: Create the Page
Again, format it as best you can, but make sure you include the map, map scale, and legend.
Again, format it as best you can, but make sure you include the map, map scale, and legend.
Rubric:
Create a chloropleth map that tests a geographic stereotype 15 points
Respond to the analysis prompts 25 points
Create an aesthetically pleasing, easily accessible webpage, on time 10 points
Create a chloropleth map that tests a geographic stereotype 15 points
Respond to the analysis prompts 25 points
Create an aesthetically pleasing, easily accessible webpage, on time 10 points