Project 2: ArcGIS OnlineObjective: For this assignment, you will demonstrate your ability to use one of the most comprehensive GIS services, and analyze ethnic trends in the United States.
|

|
Task:
Part I: Creating Your Map
- Create a new map, and select the light grey base layer
- Click to add a layer, and search "ethnicity" in the ArcGIS Online category
- Add the "USA Diversity Index" Layer by ESRI
- Adjust the layer's transparency as needed to highlight borders.
Part II: Analyzing the Data
In a word document, respond to the following directions based on the data from this map:
1. Describe how you created the map so others can repeat the process.
2. Explain the data included in this layer and it's significance.
3. Identify and describe national trends that appear on this map.
4. Select three counties and/or cities that surprised you. Why are these places more or less diverse than you expected?
5. How else could ArcGIS be useful for a high school?
Part III: Publish your Project!
Rubric:
Create a map that represents ethnic diversity across the United States 15 points
Respond to the analysis prompts 25 points
Create an aesthetically pleasing, easily accessible webpage, on time 10 points
Create a map that represents ethnic diversity across the United States 15 points
Respond to the analysis prompts 25 points
Create an aesthetically pleasing, easily accessible webpage, on time 10 points
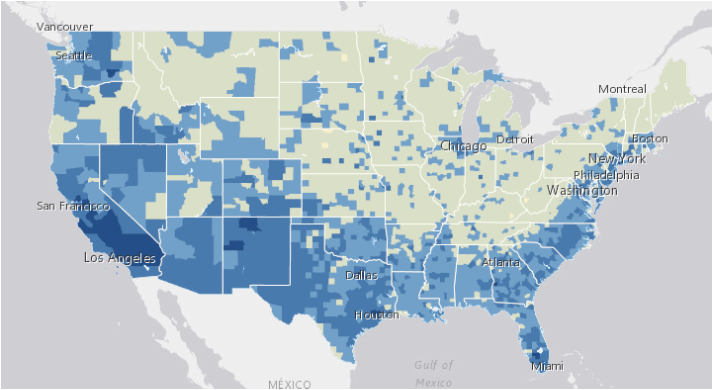
USA Diversity Index Map